Code
import pandas as pdThese exercises explore data about African American periodical poetry from 1900–1928, originally compiled by Amardeep Singh and Kate Hennessey at Lehigh University. For more context about the dataset, see the data essay.
Concepts covered:
import pandas as pdaa_df = pd.read_csv("https://raw.githubusercontent.com/melaniewalsh/responsible-datasets-in-context/main/datasets/aa-periodical-poetry/African-American-Periodical-Poetry_1900-1928-Created-by-Amardeep-Singh-and-Kate-Hennessey,-Lehigh-University.csv")aa_df.head()
aa_df['gender (if known)'].value_counts()gender (if known)
male 657
female 317
Name: count, dtype: int64aa_df['year'] = pd.to_datetime(aa_df['year'], format = "%Y")
#aa_df.set_index('year').reindex(pd.date_range('1900-01-01', '1930-12-31', freq='Y'))
# Sort years and return unique years to check for missing data
aa_df['year'].sort_values().unique()<DatetimeArray>
['1900-01-01 00:00:00', '1901-01-01 00:00:00', '1902-01-01 00:00:00',
'1903-01-01 00:00:00', '1904-01-01 00:00:00', '1905-01-01 00:00:00',
'1906-01-01 00:00:00', '1907-01-01 00:00:00', '1908-01-01 00:00:00',
'1909-01-01 00:00:00', '1910-01-01 00:00:00', '1911-01-01 00:00:00',
'1912-01-01 00:00:00', '1913-01-01 00:00:00', '1914-01-01 00:00:00',
'1915-01-01 00:00:00', '1916-01-01 00:00:00', '1917-01-01 00:00:00',
'1918-01-01 00:00:00', '1919-01-01 00:00:00', '1920-01-01 00:00:00',
'1921-01-01 00:00:00', '1922-01-01 00:00:00', '1923-01-01 00:00:00',
'1924-01-01 00:00:00', '1925-01-01 00:00:00', '1926-01-01 00:00:00',
'1927-01-01 00:00:00', '1928-01-01 00:00:00']
Length: 29, dtype: datetime64[ns]aa_gender_by_year = aa_df.groupby('year')['gender (if known)'].value_counts().reset_index()
#aa_gender_by_year['year'] = aa_gender_by_year['year'].astype(int)
aa_gender_by_year| year | gender (if known) | count | |
|---|---|---|---|
| 0 | 1900-01-01 | male | 5 |
| 1 | 1900-01-01 | female | 1 |
| 2 | 1901-01-01 | male | 31 |
| 3 | 1901-01-01 | female | 3 |
| 4 | 1902-01-01 | male | 5 |
| 5 | 1902-01-01 | female | 1 |
| 6 | 1903-01-01 | male | 15 |
| 7 | 1903-01-01 | female | 6 |
| 8 | 1904-01-01 | male | 12 |
| 9 | 1905-01-01 | male | 44 |
| 10 | 1905-01-01 | female | 24 |
| 11 | 1906-01-01 | male | 55 |
| 12 | 1906-01-01 | female | 22 |
| 13 | 1907-01-01 | male | 37 |
| 14 | 1907-01-01 | female | 8 |
| 15 | 1908-01-01 | male | 10 |
| 16 | 1908-01-01 | female | 1 |
| 17 | 1909-01-01 | male | 14 |
| 18 | 1909-01-01 | female | 2 |
| 19 | 1910-01-01 | male | 4 |
| 20 | 1910-01-01 | female | 1 |
| 21 | 1911-01-01 | male | 5 |
| 22 | 1912-01-01 | male | 3 |
| 23 | 1912-01-01 | female | 2 |
| 24 | 1913-01-01 | male | 7 |
| 25 | 1914-01-01 | male | 6 |
| 26 | 1914-01-01 | female | 1 |
| 27 | 1915-01-01 | male | 8 |
| 28 | 1915-01-01 | female | 3 |
| 29 | 1916-01-01 | female | 11 |
| 30 | 1916-01-01 | male | 8 |
| 31 | 1917-01-01 | female | 11 |
| 32 | 1917-01-01 | male | 11 |
| 33 | 1918-01-01 | male | 8 |
| 34 | 1918-01-01 | female | 4 |
| 35 | 1919-01-01 | male | 14 |
| 36 | 1919-01-01 | female | 7 |
| 37 | 1920-01-01 | male | 8 |
| 38 | 1920-01-01 | female | 7 |
| 39 | 1921-01-01 | male | 30 |
| 40 | 1921-01-01 | female | 6 |
| 41 | 1922-01-01 | female | 8 |
| 42 | 1922-01-01 | male | 5 |
| 43 | 1923-01-01 | male | 22 |
| 44 | 1923-01-01 | female | 8 |
| 45 | 1924-01-01 | female | 32 |
| 46 | 1924-01-01 | male | 26 |
| 47 | 1925-01-01 | male | 57 |
| 48 | 1925-01-01 | female | 27 |
| 49 | 1926-01-01 | male | 47 |
| 50 | 1926-01-01 | female | 30 |
| 51 | 1927-01-01 | male | 94 |
| 52 | 1927-01-01 | female | 58 |
| 53 | 1928-01-01 | male | 66 |
| 54 | 1928-01-01 | female | 33 |
# If there were missing years, this is how you might handle it
# Create a dataframe with a complete range of years from 1900 to 1930
# years = pd.DataFrame({'year': pd.date_range(start='1900', end='1930', freq='YS')})

# Merge with existing dataframe
# aa_gender_by_year = pd.merge(years, aa_gender_by_year, on='year', how='left')

# Fill NaN values
#aa_gender_by_year['gender (if known)'] = aa_gender_by_year['gender (if known)'].fillna("no author recorded")

#aa_gender_by_year['count'] = aa_gender_by_year['count'].fillna(0)

# Sort years and return unique years to check for missing data
#aa_gender_by_year['year'].sort_values().unique()

#aa_gender_by_yearimport seaborn as sns
import matplotlib.pyplot as plt
import matplotlib.dates as mdates
# Create the line plot
ax = sns.lineplot(data=aa_gender_by_year, x="year", y="count", hue="gender (if known)")
# Set x-axis major ticks to every 5 years
ax.xaxis.set_major_locator(mdates.YearLocator(5))
# Format the x-axis labels to show the year only
#ax.xaxis.set_major_formatter(mdates.DateFormatter('%Y'))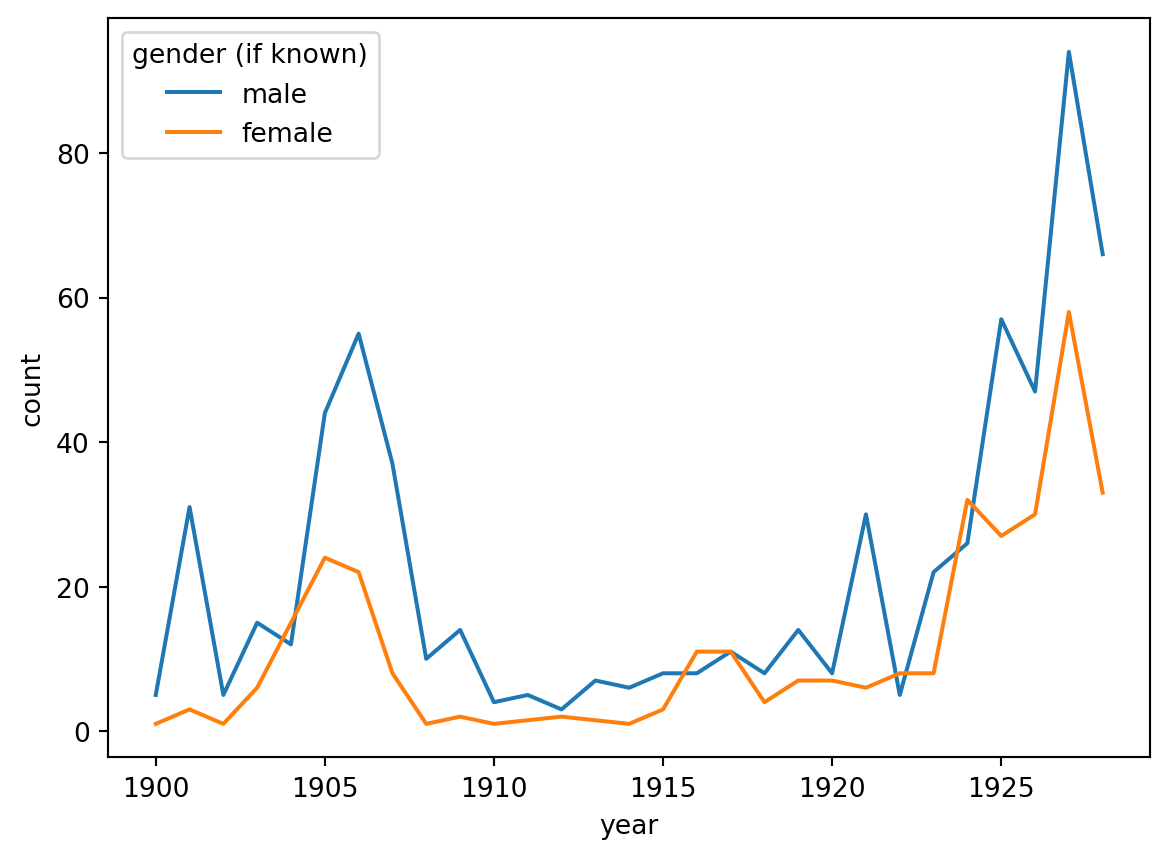
from matplotlib.ticker import MultipleLocator

plt.figure(figsize=(13.7, 8.27))

# Create the bar plot
ax = sns.barplot(data=aa_gender_by_year,
# pull out just the year
x=aa_gender_by_year["year"].dt.year, y="count", hue="gender (if known)")

# Set x-axis major ticks every 1 year
ax.xaxis.set_major_locator(MultipleLocator(1))

# Set x-axis labels to the desired format (only show every 5th year)
ax.set_xticklabels([date.year for date in pd.date_range(start='1900', end='1930', freq='YS')], rotation=45)

plt.show()
/tmp/ipykernel_24615/3665439903.py:14: UserWarning: set_ticklabels() should only be used with a fixed number of ticks, i.e. after set_ticks() or using a FixedLocator.
ax.set_xticklabels([date.year for date in pd.date_range(start='1900', end='1930', freq='YS')], rotation=45)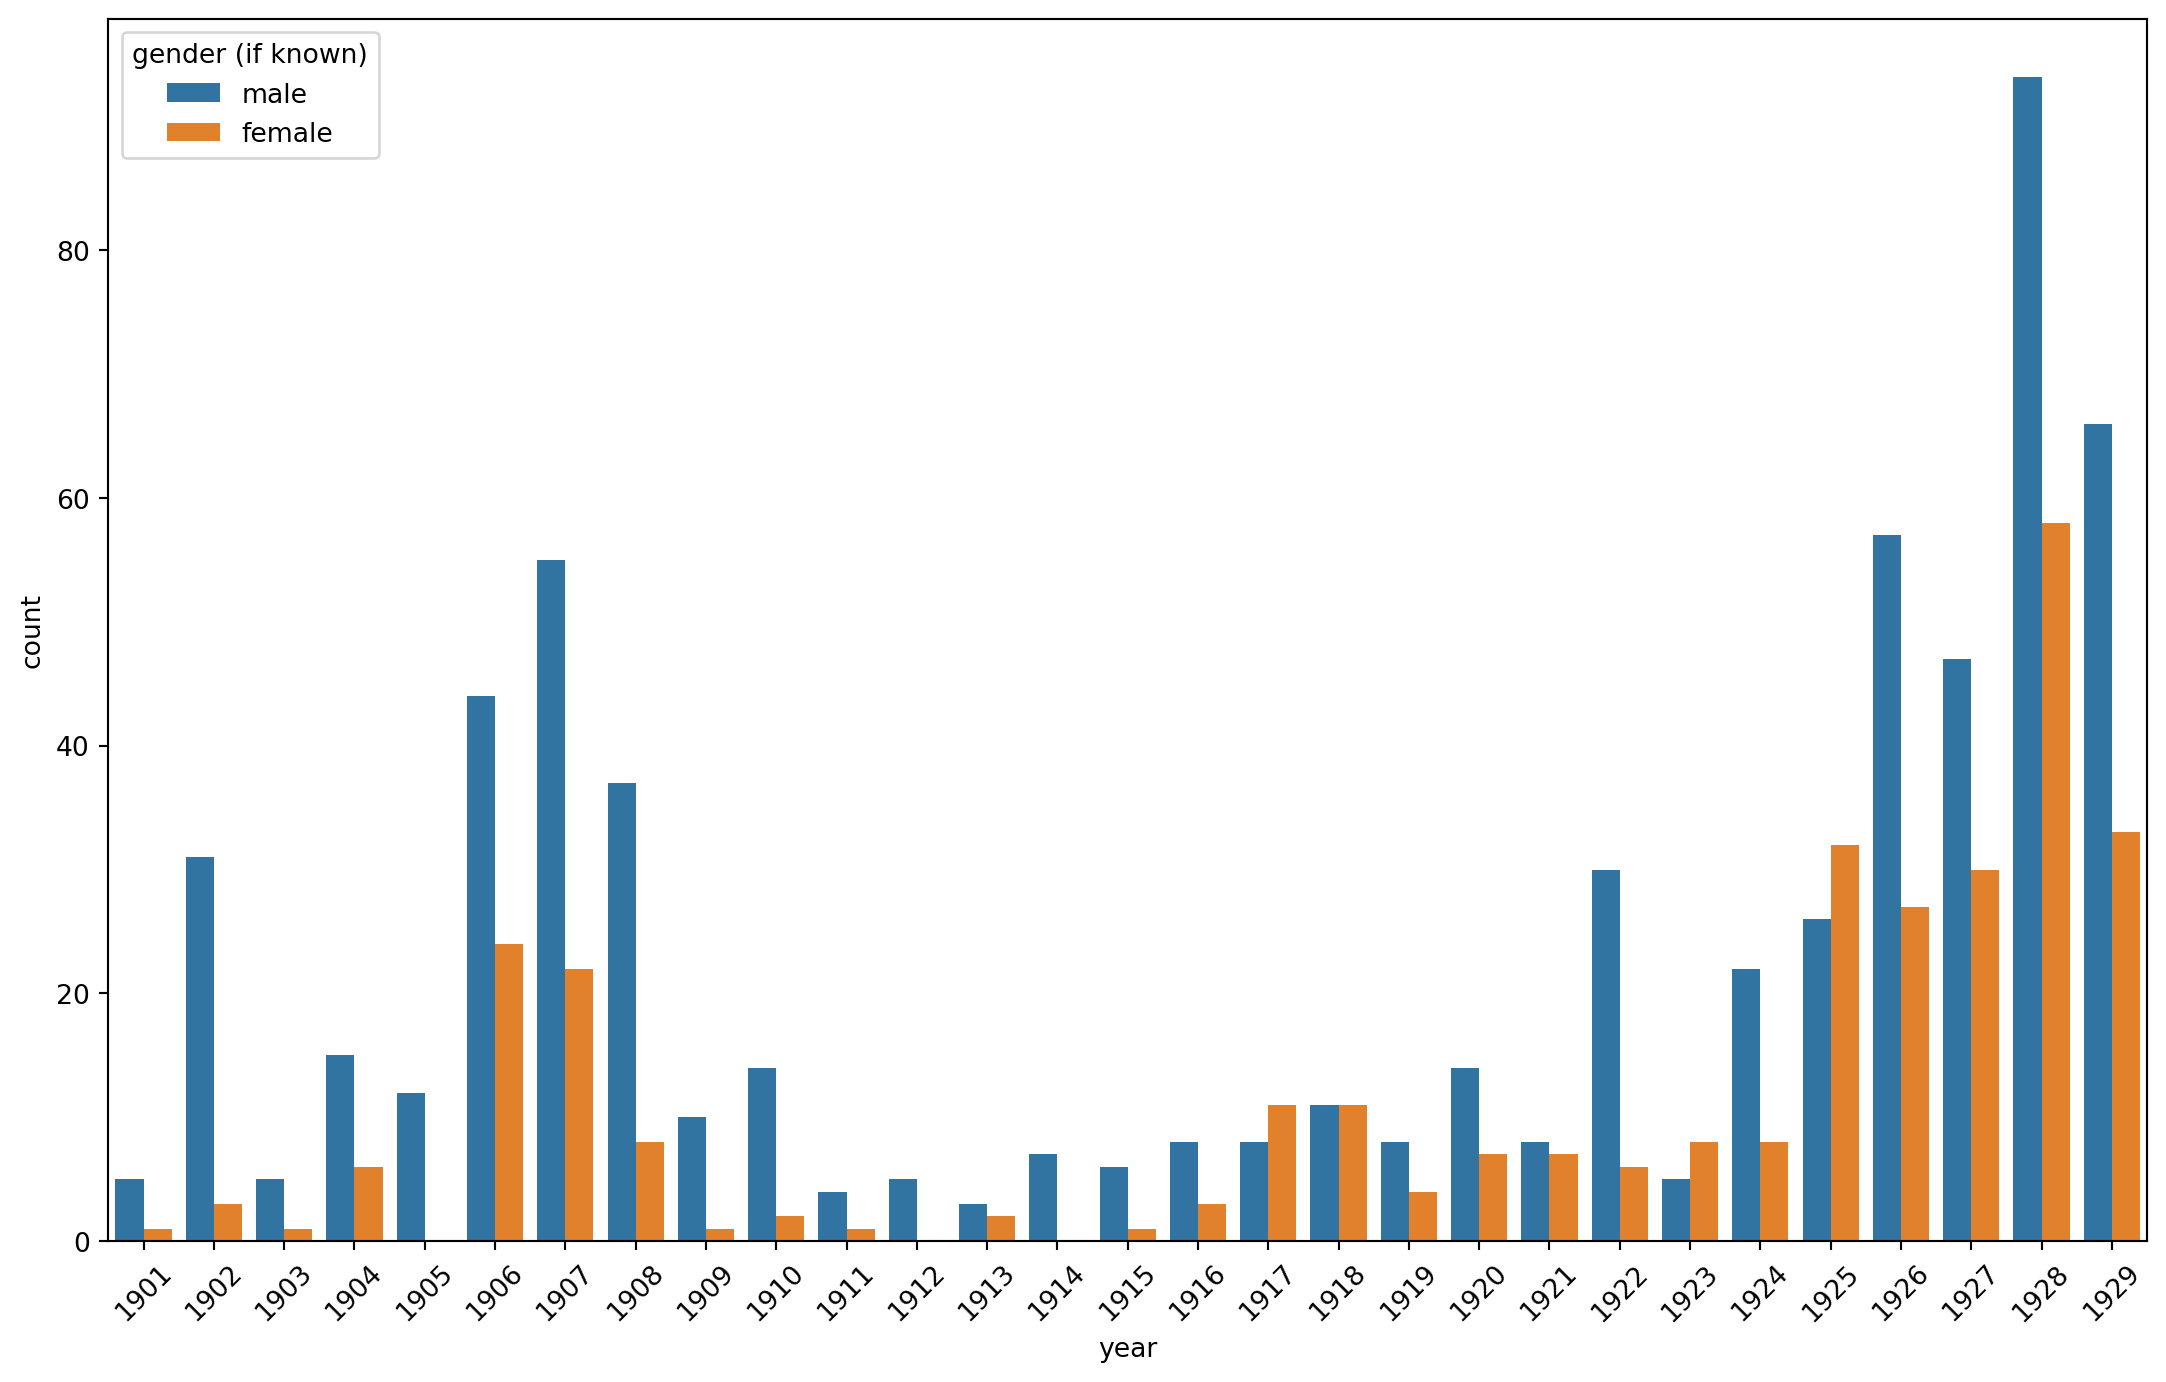
import plotly.express as px

# Create the interactive line plot with Plotly
fig = px.line(aa_gender_by_year,
              x='year',
              y='count',
              color='gender (if known)',
              title='Author Gender by Year')
fig.show()fig = px.bar(aa_gender_by_year,
x='year',
y='count',
color='gender (if known)',
title='Author Gender by Year')
fig.show()