These exercises explore checkout data from the Seattle Public Library for authors in the post-1945 volumes of the Norton Anthology of American Literature, one of the most widely used literary anthologies in U.S. college classrooms. The dataset was compiled as part of the research paper “The Canon in Circulation” (Gupta et al., 2025). The code and data are available on GitHub, and you can explore more of the analysis here. For more context, see the Library Checkouts for the Top 500 “Greatest” Novels data essay.
Concepts covered:
Groupby and aggregation (sum of checkouts)
Sorting and ranking (top N values)
Horizontal bar charts
Filtering by a specific author
Time series line plots (monthly checkouts over time)
Warning: 'xfun::attr()' is deprecated.
Use 'xfun::attr2()' instead.
See help("Deprecated")
CheckoutDate
UsageClass
CheckoutOutType
MaterialType
CheckoutYear
CheckoutMonth
Checkouts
Title
Creator
Subjects
Publisher
PublicationYear
ISBN
Normalized.Creator
Normalized.Title
BirthYear
DeathYear
Work.In.Norton
2016-10-01
Digital
OverDrive
AUDIOBOOK
2016
10
1
The Natural (Unabridged)
Bernard Malamud
Classic Literature, Fiction
Blackstone Audio, Inc.
2008
Bernard Malamud
The Natural
1914
1986
False
2016-10-01
Digital
OverDrive
EBOOK
2016
10
1
The Assistant
Bernard Malamud
Fiction, Literature
Macmillan Publishers
2013
Bernard Malamud
The Assistant
1914
1986
False
2016-11-01
Digital
OverDrive
EBOOK
2016
11
1
The Magic Barrel
Bernard Malamud
Fiction, Literature
Macmillan Publishers
2013
Bernard Malamud
The Magic Barrel
1914
1986
True
2016-11-01
Digital
OverDrive
EBOOK
2016
11
1
The Assistant
Bernard Malamud
Fiction, Literature
Macmillan Publishers
2013
Bernard Malamud
The Assistant
1914
1986
False
2016-12-01
Digital
OverDrive
EBOOK
2016
12
1
The Fixer: A Novel
Bernard Malamud
Fiction, Literature
Macmillan Publishers
2013
Bernard Malamud
The Fixer
1914
1986
False
2016-12-01
Digital
OverDrive
EBOOK
2016
12
1
The Natural
Bernard Malamud
Fiction, Literature
Macmillan Publishers
2013
9.78147E+12
Bernard Malamud
The Natural
1914
1986
False
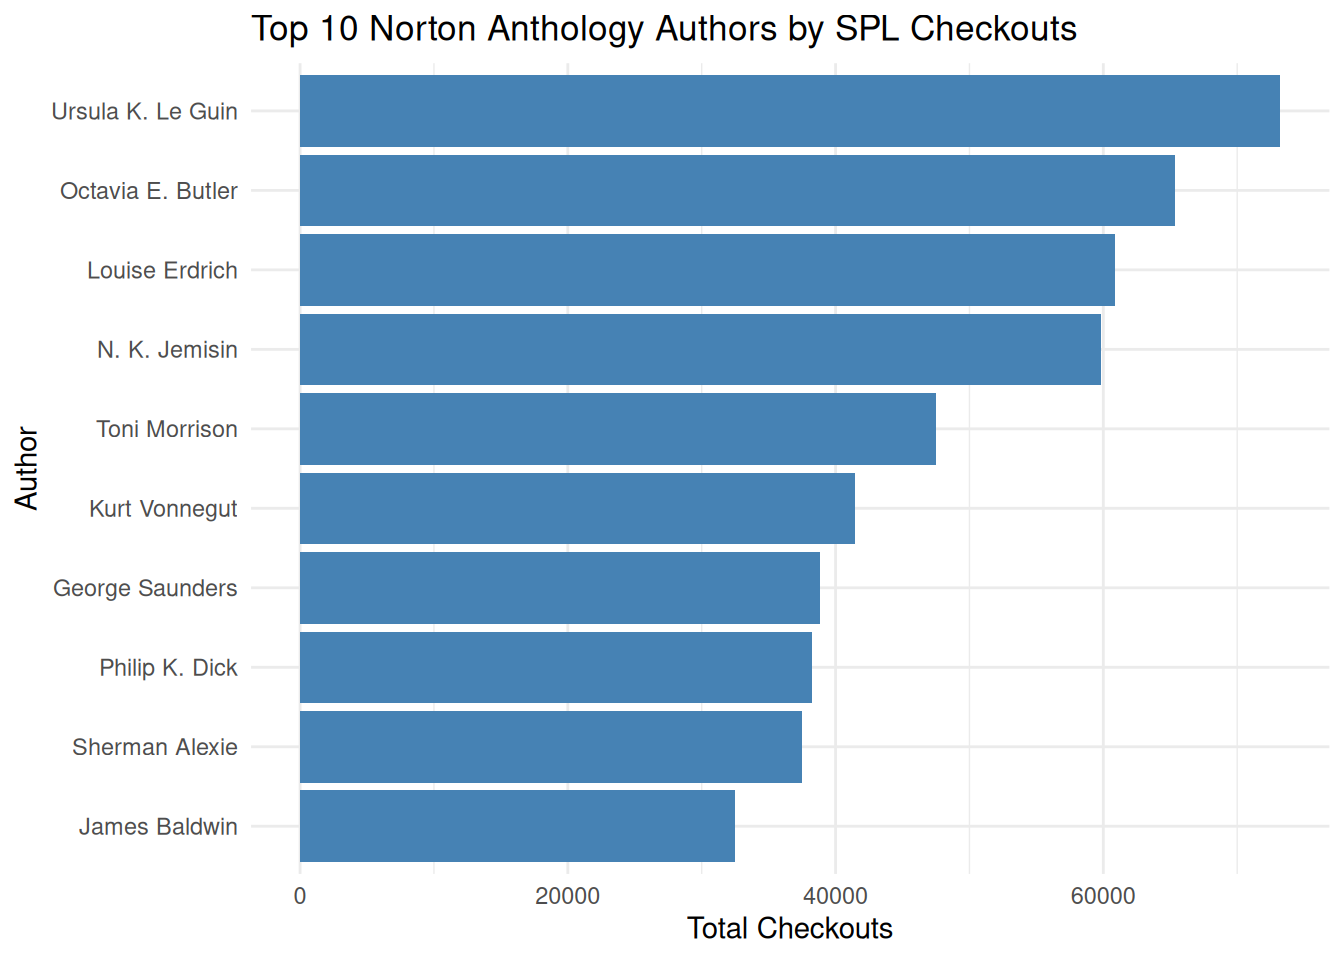
Exercise 1
Find the top 10 authors by total checkouts in the Norton Anthology SPL checkouts dataset. Create a horizontal bar chart to visualize the results.
Save the top authors as top_authors.
Code
top_authors <- norton_df %>%group_by(Normalized.Creator) %>%summarize(total_checkouts =sum(Checkouts)) %>%arrange(desc(total_checkouts)) %>%head(10)ggplot(top_authors, aes(x =reorder(Normalized.Creator, total_checkouts), y = total_checkouts)) +geom_bar(stat ="identity", fill ="steelblue") +coord_flip() +labs(title ="Top 10 Norton Anthology Authors by SPL Checkouts",x ="Author", y ="Total Checkouts") +theme_minimal()
Discuss/consider: Which authors from the Norton Anthology are most popular at the Seattle Public Library? Are these authors you expected to see at the top?
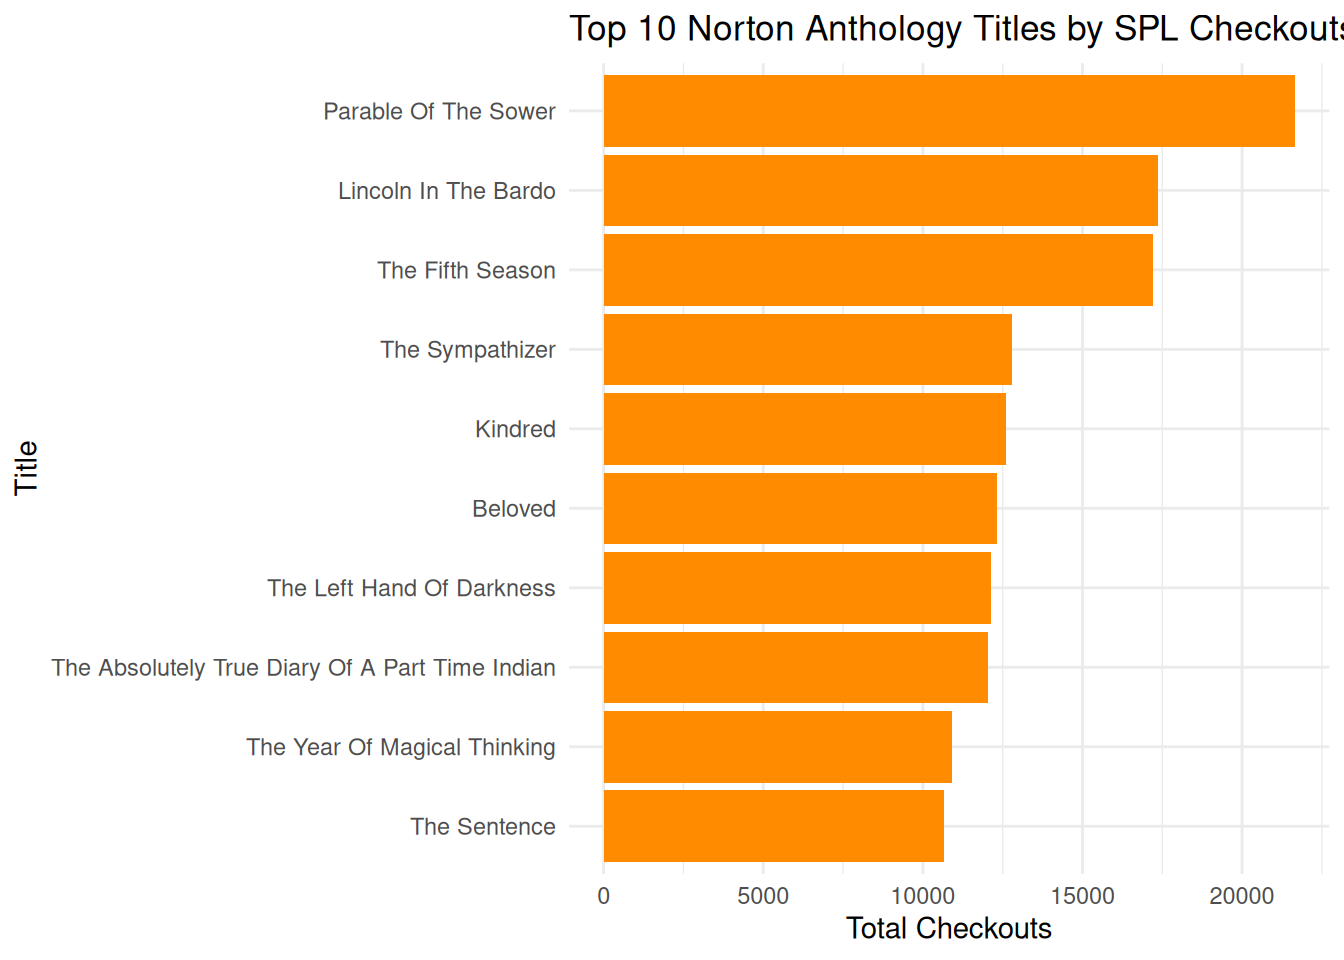
Exercise 2
Find the top 10 titles by total checkouts. Create a horizontal bar chart to visualize the results.
Save the top titles as top_titles.
Code
top_titles <- norton_df %>%group_by(Normalized.Title) %>%summarize(total_checkouts =sum(Checkouts)) %>%arrange(desc(total_checkouts)) %>%head(10)ggplot(top_titles, aes(x =reorder(Normalized.Title, total_checkouts), y = total_checkouts)) +geom_bar(stat ="identity", fill ="darkorange") +coord_flip() +labs(title ="Top 10 Norton Anthology Titles by SPL Checkouts",x ="Title", y ="Total Checkouts") +theme_minimal()
Discuss/consider: Which titles are checked out most frequently? How do these compare to the most popular authors?
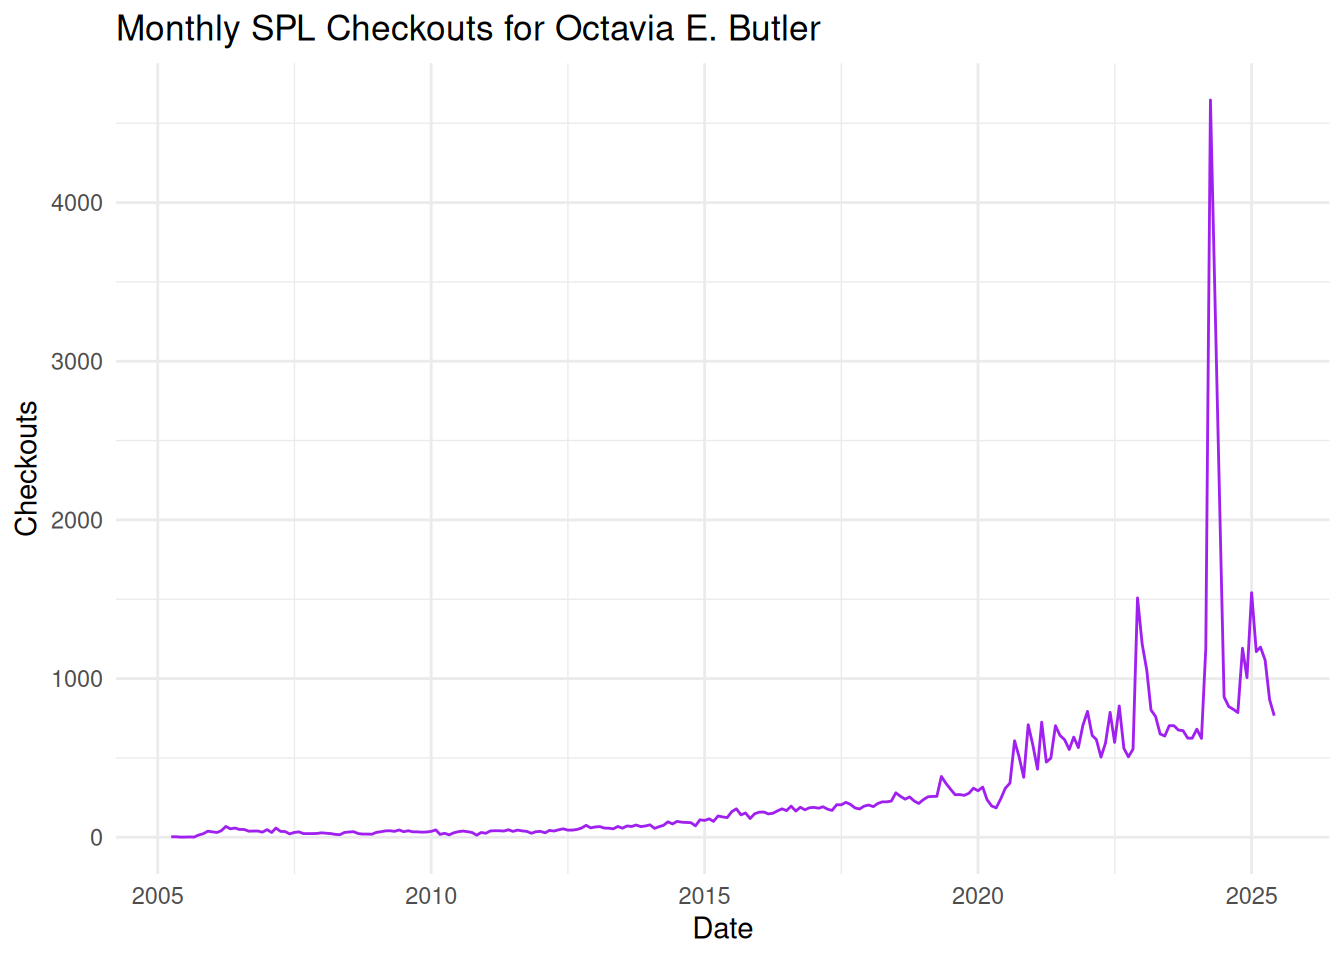
Exercise 3
Create a time series line plot showing monthly checkouts for Octavia E. Butler over time.
Filter the data for Octavia E. Butler, group by year and month, and plot the results.
Code
butler_df <- norton_df %>%filter(Normalized.Creator =="Octavia E. Butler") %>%group_by(CheckoutYear, CheckoutMonth) %>%summarize(monthly_checkouts =sum(Checkouts), .groups ="drop") %>%mutate(date =as.Date(paste(CheckoutYear, sprintf("%02d", CheckoutMonth), "01", sep ="-")))ggplot(butler_df, aes(x = date, y = monthly_checkouts)) +geom_line(color ="purple") +labs(title ="Monthly SPL Checkouts for Octavia E. Butler",x ="Date", y ="Checkouts") +theme_minimal()
Discuss/consider: What patterns do you notice in the checkout trends for Octavia E. Butler? Are there any notable spikes or dips? What might explain them?
Source Code
---title: "Norton Anthology & SPL Checkouts Data Exploration (Solution)"date: "2026-02-25"categories: [dplyr, exercise, solution]format: html: defaultcode-overflow: wrapcode-fold: showeditor: visualdf-print: kableR.options: warn: falsecode-tools: trueexecute: eval: true---# <span style="color:red;"> Solution </span>## Norton Anthology & SPL Checkouts Data Exploration<span style="color:green;">[Exercise Without Solutions](Norton-Anthology-SPL-Checkouts-Exercise.qmd)</span>These exercises explore checkout data from the Seattle Public Library for authors in the post-1945 volumes of the *Norton Anthology of American Literature*, one of the most widely used literary anthologies in U.S. college classrooms. The dataset was compiled as part of the research paper ["The Canon in Circulation"](https://doi.org/10.63744/P6qPH135jhY2) (Gupta et al., 2025). The code and data are available on [GitHub](https://github.com/melaniewalsh/Canon-in-Circulation), and you can explore more of the analysis [here](https://melaniewalsh.github.io/whats-seattle-reading/posts/norton-anthology-american/). For more context, see the [Library Checkouts for the Top 500 "Greatest" Novels data essay](../index.qmd).**Concepts covered:**- Groupby and aggregation (sum of checkouts)- Sorting and ranking (top N values)- Horizontal bar charts- Filtering by a specific author- Time series line plots (monthly checkouts over time)# Load the data```{r}#| message: falselibrary(dplyr)library(ggplot2)norton_df <-read.csv("https://seattle-library-checkout-data.s3.us-west-2.amazonaws.com/norton-anthology_spl-checkouts_2005-2025.csv",stringsAsFactors =FALSE)head(norton_df)```# Exercise 1Find the top 10 authors by total checkouts in the Norton Anthology SPL checkouts dataset. Create a horizontal bar chart to visualize the results.Save the top authors as `top_authors`.```{r}top_authors <- norton_df %>%group_by(Normalized.Creator) %>%summarize(total_checkouts =sum(Checkouts)) %>%arrange(desc(total_checkouts)) %>%head(10)ggplot(top_authors, aes(x =reorder(Normalized.Creator, total_checkouts), y = total_checkouts)) +geom_bar(stat ="identity", fill ="steelblue") +coord_flip() +labs(title ="Top 10 Norton Anthology Authors by SPL Checkouts",x ="Author", y ="Total Checkouts") +theme_minimal()```Discuss/consider: Which authors from the Norton Anthology are most popular at the Seattle Public Library? Are these authors you expected to see at the top?# Exercise 2Find the top 10 titles by total checkouts. Create a horizontal bar chart to visualize the results.Save the top titles as `top_titles`.```{r}top_titles <- norton_df %>%group_by(Normalized.Title) %>%summarize(total_checkouts =sum(Checkouts)) %>%arrange(desc(total_checkouts)) %>%head(10)ggplot(top_titles, aes(x =reorder(Normalized.Title, total_checkouts), y = total_checkouts)) +geom_bar(stat ="identity", fill ="darkorange") +coord_flip() +labs(title ="Top 10 Norton Anthology Titles by SPL Checkouts",x ="Title", y ="Total Checkouts") +theme_minimal()```Discuss/consider: Which titles are checked out most frequently? How do these compare to the most popular authors?# Exercise 3Create a time series line plot showing monthly checkouts for Octavia E. Butler over time.Filter the data for Octavia E. Butler, group by year and month, and plot the results.```{r}butler_df <- norton_df %>%filter(Normalized.Creator =="Octavia E. Butler") %>%group_by(CheckoutYear, CheckoutMonth) %>%summarize(monthly_checkouts =sum(Checkouts), .groups ="drop") %>%mutate(date =as.Date(paste(CheckoutYear, sprintf("%02d", CheckoutMonth), "01", sep ="-")))ggplot(butler_df, aes(x = date, y = monthly_checkouts)) +geom_line(color ="purple") +labs(title ="Monthly SPL Checkouts for Octavia E. Butler",x ="Date", y ="Checkouts") +theme_minimal()```Discuss/consider: What patterns do you notice in the checkout trends for Octavia E. Butler? Are there any notable spikes or dips? What might explain them?